
Skip to content
Office Building with Light

Energy Performance Analytics

Every building consumes more energy than it needs to. We compare your actual consumption data with a demand analysis, identify hidden OpEx drivers, and show you where you can make operations more cost-effective through better control—without expensive renovations.

Buildings work—but are they also cost-effective?

In practice, there are often significant discrepancies of 30–100% between planned and actual consumption. However, without a reliable benchmark, it is impossible to determine whether the consumption is justified or what specific changes can be made in operations.
Data without a reference

Monitoring systems provide consumption data, but without an analysis of demand for comparison. As a result, it remains unclear whether a system is incorrectly configured or is actually operating efficiently

 
Changes are expensive

Changes to plant engineering are costly—and without simulation, it’s nearly impossible to estimate in advance what a particular change will actually achieve.

 
No consolidated model

The plant data is scattered, and the building is complex. There is no unified model that can be used to simulate what changes can be made during operation and what benefits they would bring.


What Is Energy Performance Analytics?

Energy Performance Analytics evaluates how your building performs during operation based on actual consumption data and thermodynamic system simulations. Optionally, sensor data from the room can be integrated; we then compare target and actual values daily and determine, down to the hourly level, which systems are performing well and which are not. This allows you to see exactly how energy and operating costs can be reduced. A connection to the BMS system is not required.

What Energy Performance Analytics Includes

We identify performance gaps, explain their causes, and evaluate measures based on cost-effectiveness.


Building Two: View from Below
TOUCH
Performance Gap Analysis
Performance Gap AnalysisA comparison of actual versus target consumption and demand, broken down by energy source, system, and time period. This makes it possible to measure deviations and identify potential savings.
Round Glass Building
TOUCH
Diagnosis of the Cause

Every deviation is explained in physical terms. Is it due to the building envelope, building systems, controls, or usage? You see not only the "what," but also the "why."

Existing Building copy
TOUCH
Measures and Maintenance

From optimizing control systems to replacing equipment—prioritized by leverage, cost, and impact. The maintenance budget becomes a lever for transformation.
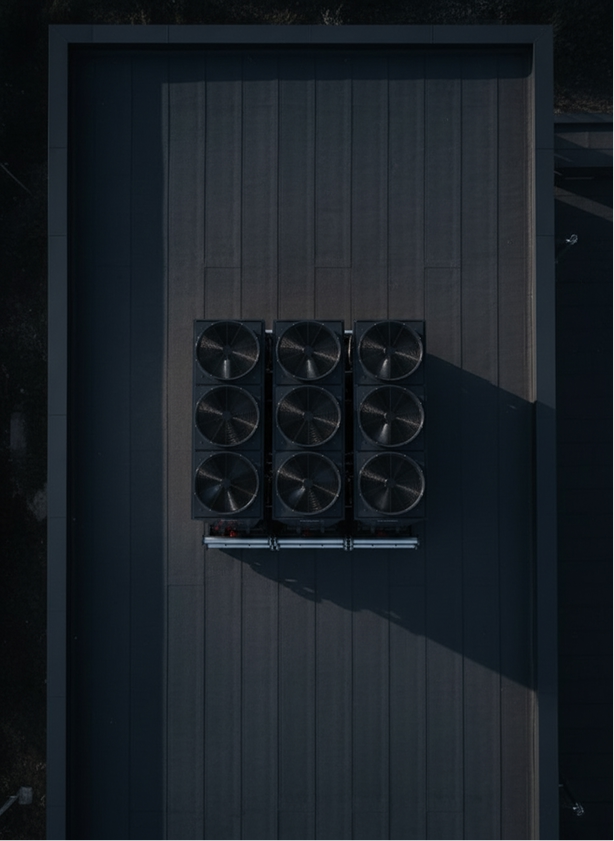
Top-Mounted Fan
TOUCH
Continuous Monitoring

Ongoing reconciliation with automatic deviation alerts, including responses to weather conditions such as heat waves. Initial results based on at least one quarter of data.

Optimal operation, lowest costs

You’ll receive ready-to-use, actionable results that are clearly presented and directly comparable. No training required, no learning curve: We provide the reliable foundation you need to operate your building cost-effectively.

Customers who use Energy Performance Analytics

Frequently Asked Questions

What information do I need to provide? At a minimum, please provide your consumption data in CSV or Excel format—ideally covering several months so that seasonal effects are reflected. The more data we have, the more detailed the analysis will be. We’ll supplement this with additional building information via the digital twin.
For which types of buildings is Energy Performance Analytics suitable?

In principle, this applies to all types of buildings—office, residential, commercial, and mixed-use. The more complex the building systems, the greater the potential for optimization, as a general rule.

How much does it cost to optimize a system through improved control—do I need to make an investment?

Much of the optimization involves controlling and adjusting existing systems and does not require any capital investments. Where replacing a system makes sense, we document this with a cost-benefit analysis so that you can decide between cost-free optimization and capital investments.

How often do I receive new reports?

If you analyze only consumption data, you will receive a report for each data delivery. With optional integration of live data, the target-actual comparison is performed continuously, with automatic notifications in the event of deviations.

Can I share the results with my team or external service providers?

Yes. Recommendations for action and all raw data are available for download and can be shared with internal teams, facility management, or contractors.

What happens after optimization? Does the effect last?

Without monitoring, systems gradually drift away from their optimal performance over time. Continuous monitoring detects such deviations early on, ensuring that the efficiency gains achieved are maintained over the long term.

See your building's performance gap.

AI-powered. Efficient. Sustainable. We'll show you how to transform the future of your buildings.